
How to invest for retirement, with an easy calculator
Or a spreadsheet! If that's your thing.

Retirement is a big word. The largest numbers in most people’s financial lives are in retirement planning. The word also carries emotional weight. Some people dread thinking about retirement and feel hopelessly behind. Others have given up and embraced a flippant attitude of “I’ll work until I die”. But there are encouraging numbers of young people who understand the principles of compound growth and tax-advantaged accounts, who are taking retirement planning into their own hands.
Contemplating retirement provides the opportunity to start asking yourself even bigger questions. What do you value about money and what do you want to do with it? How much is enough? How much time and how many years do you want to spend working for pay? After approaching financial independence, is there something you would enjoy doing that pays less or nothing at all?
We’ll walk through a simple way to approach retirement investing, and you can plug your own numbers into a calculator I made. There’s a fair amount of math in this post, but understanding every detail is not needed to use the calculator for your own planning. The point of the calculator is to make it easy. We’ll also evaluate two popular rules of thumb.

Compound growth and inflation
If your retirement is more than a few years away, price inflation means that your standard of living will demand a lot more dollars by the time you retire. But that’s no problem! We can account for that when planning our retirement.
Compound growth is a process of repeatedly multiplying your invested assets. Mathematically, inflation works the same way. If you invest for 35 years and your average return is 6.8%, your investment multiplies by 10. Inflation rates compound too: if average inflation is 2% over the same period, prices double.
So after 35 years you have 10 times as many dollars, but you also need to spend twice as many dollars to buy the same stuff. 10 times as much money divided by 2 times as much spending gives you 5 times as much purchasing power — you can buy a lot more with that asset because its performance was much greater than inflation.
If you’re reading in the mobile app, the equations below might look ugly. It looks much better if you copy the post link into your browser.
Now we can introduce the jargon needed for retirement planning. That 6.8% figure is our nominal return — the raw number, with no inflation adjustment. Our return after inflation is called the real return. We know the nominal return was 6.8% and inflation was 2%, so how do we calculate the real return?
A multiplier of 1.0471 converts to a 4.71% real return. That rate of return lets us understand how our purchasing power — our capacity to buy stuff — changes over time. Purchasing power is what matters to a consumer and long-term investor. A 6.8% nominal return indicates how quickly our investments grow relative to the dollar, but a 4.71% real return reflects the growth rate of our purchasing power.
If you need clarification on the math above, we covered the fundamentals in another post. For a deeper dive, you can check out the companion post for essential compound growth calculations that everyone should know how to do. Now we can run some numbers!
Investing for retirement
First let’s set a goal: we want to build an investment portfolio that lets us withdraw a given number of dollars each year during retirement. We’ll express “income” from the portfolio in today’s dollars, because that’s what we can relate to — inflated dollars 20 or 40 years in the future are not intuitive. That provides our first variable:
Desired income in today’s dollars.
You don’t have to know when you will retire, but you should form an approximate goal for the age at which you’ll have the option to retire. It’s often said that retirement is a financial status, not an age. It isn’t granted automatically — you have to prepare for it. You could aim to retire at 40, 60, or 75. The older your target retirement age, the more likely it becomes that unexpected obstacles will make it harder to keep earning. So our second variable is:
Time horizon: the number of years until your retirement age.
Let’s pick some real numbers. Retirement experts find that overall retirement spending tends to be 70-80% of pre-retirement spending. And because you no longer need to save money once you’ve retired, the “income” you require from investments and Social Security for a particular standard of living is inherently lower than the income needed during working years. A 64-year-old making $70K who saved $20K in the last year needs only $50K/year to support the same lifestyle — in fact, even less because they’ll likely be taxed at lower rates in retirement.
We’ll discuss supplemental forms of income like Social Security later. For now we’ll pretend that we’re a young, middle-class earner who expects modest pay raises throughout their career. We aim to be prepared for retirement in 40 years, and we want a total retirement income of $60K. We’ll conservatively assume $15K of Social Security old age benefits per year. We don’t expect any pension income. So we need to generate $45K from our own investments. Again, all of these are expressed in today’s dollars.
Let’s start with a simple method: we make an initial contribution in the first year to our retirement investments, and every year we increase that contribution by the inflation rate. What variables do we use to figure out the size of that initial contribution? We already have our time horizon and desired income. We also need the:
Nominal rate of return on investments.
Inflation rate.
Initial withdrawal rate (e.g., 4% of a $1M portfolio is $40K of income).
Current balance of retirement investments.
We’ll assume an 8% average nominal return for a broad stock portfolio, based on the global average since 1900. We’ll use 2.5% as an average inflation rate, which aligns with average rates globally and in the modern United States.1 We can calculate our real return — the return after inflation:
So we expect a real return of 5.37% per year.2
We’ll assume an initial withdrawal rate of 4%. There will be an entire post about how to live on your nest egg in retirement, so for now we’re going to accept that it’s okay to withdraw 4% of our portfolio in the first year.
Since we’re a 20-something just beginning to plan for retirement, the current balance of our retirement portfolio is zero.
How big will our nest egg be at retirement, under these assumptions? To withdraw 4% of the portfolio and get $45,000, it would need to be $45,000 / .04 = $1,125,000. But that’s in today’s dollars! Total inflation over 40 years with an average rate of 2.5% is a factor of 1.025^40 = 2.69. We multiply $1.125M by 2.69 and find that the nest egg in 40 years will be $3.02M.
That’s the actual dollar amount we’re targeting in 40 years, to provide a standard of living similar to $45K/year today. How do we get there?
We start by investing $8,080 in the first year, then increase by inflation every year. Since we expect annual inflation to be 2.5%, the second year’s contribution is:
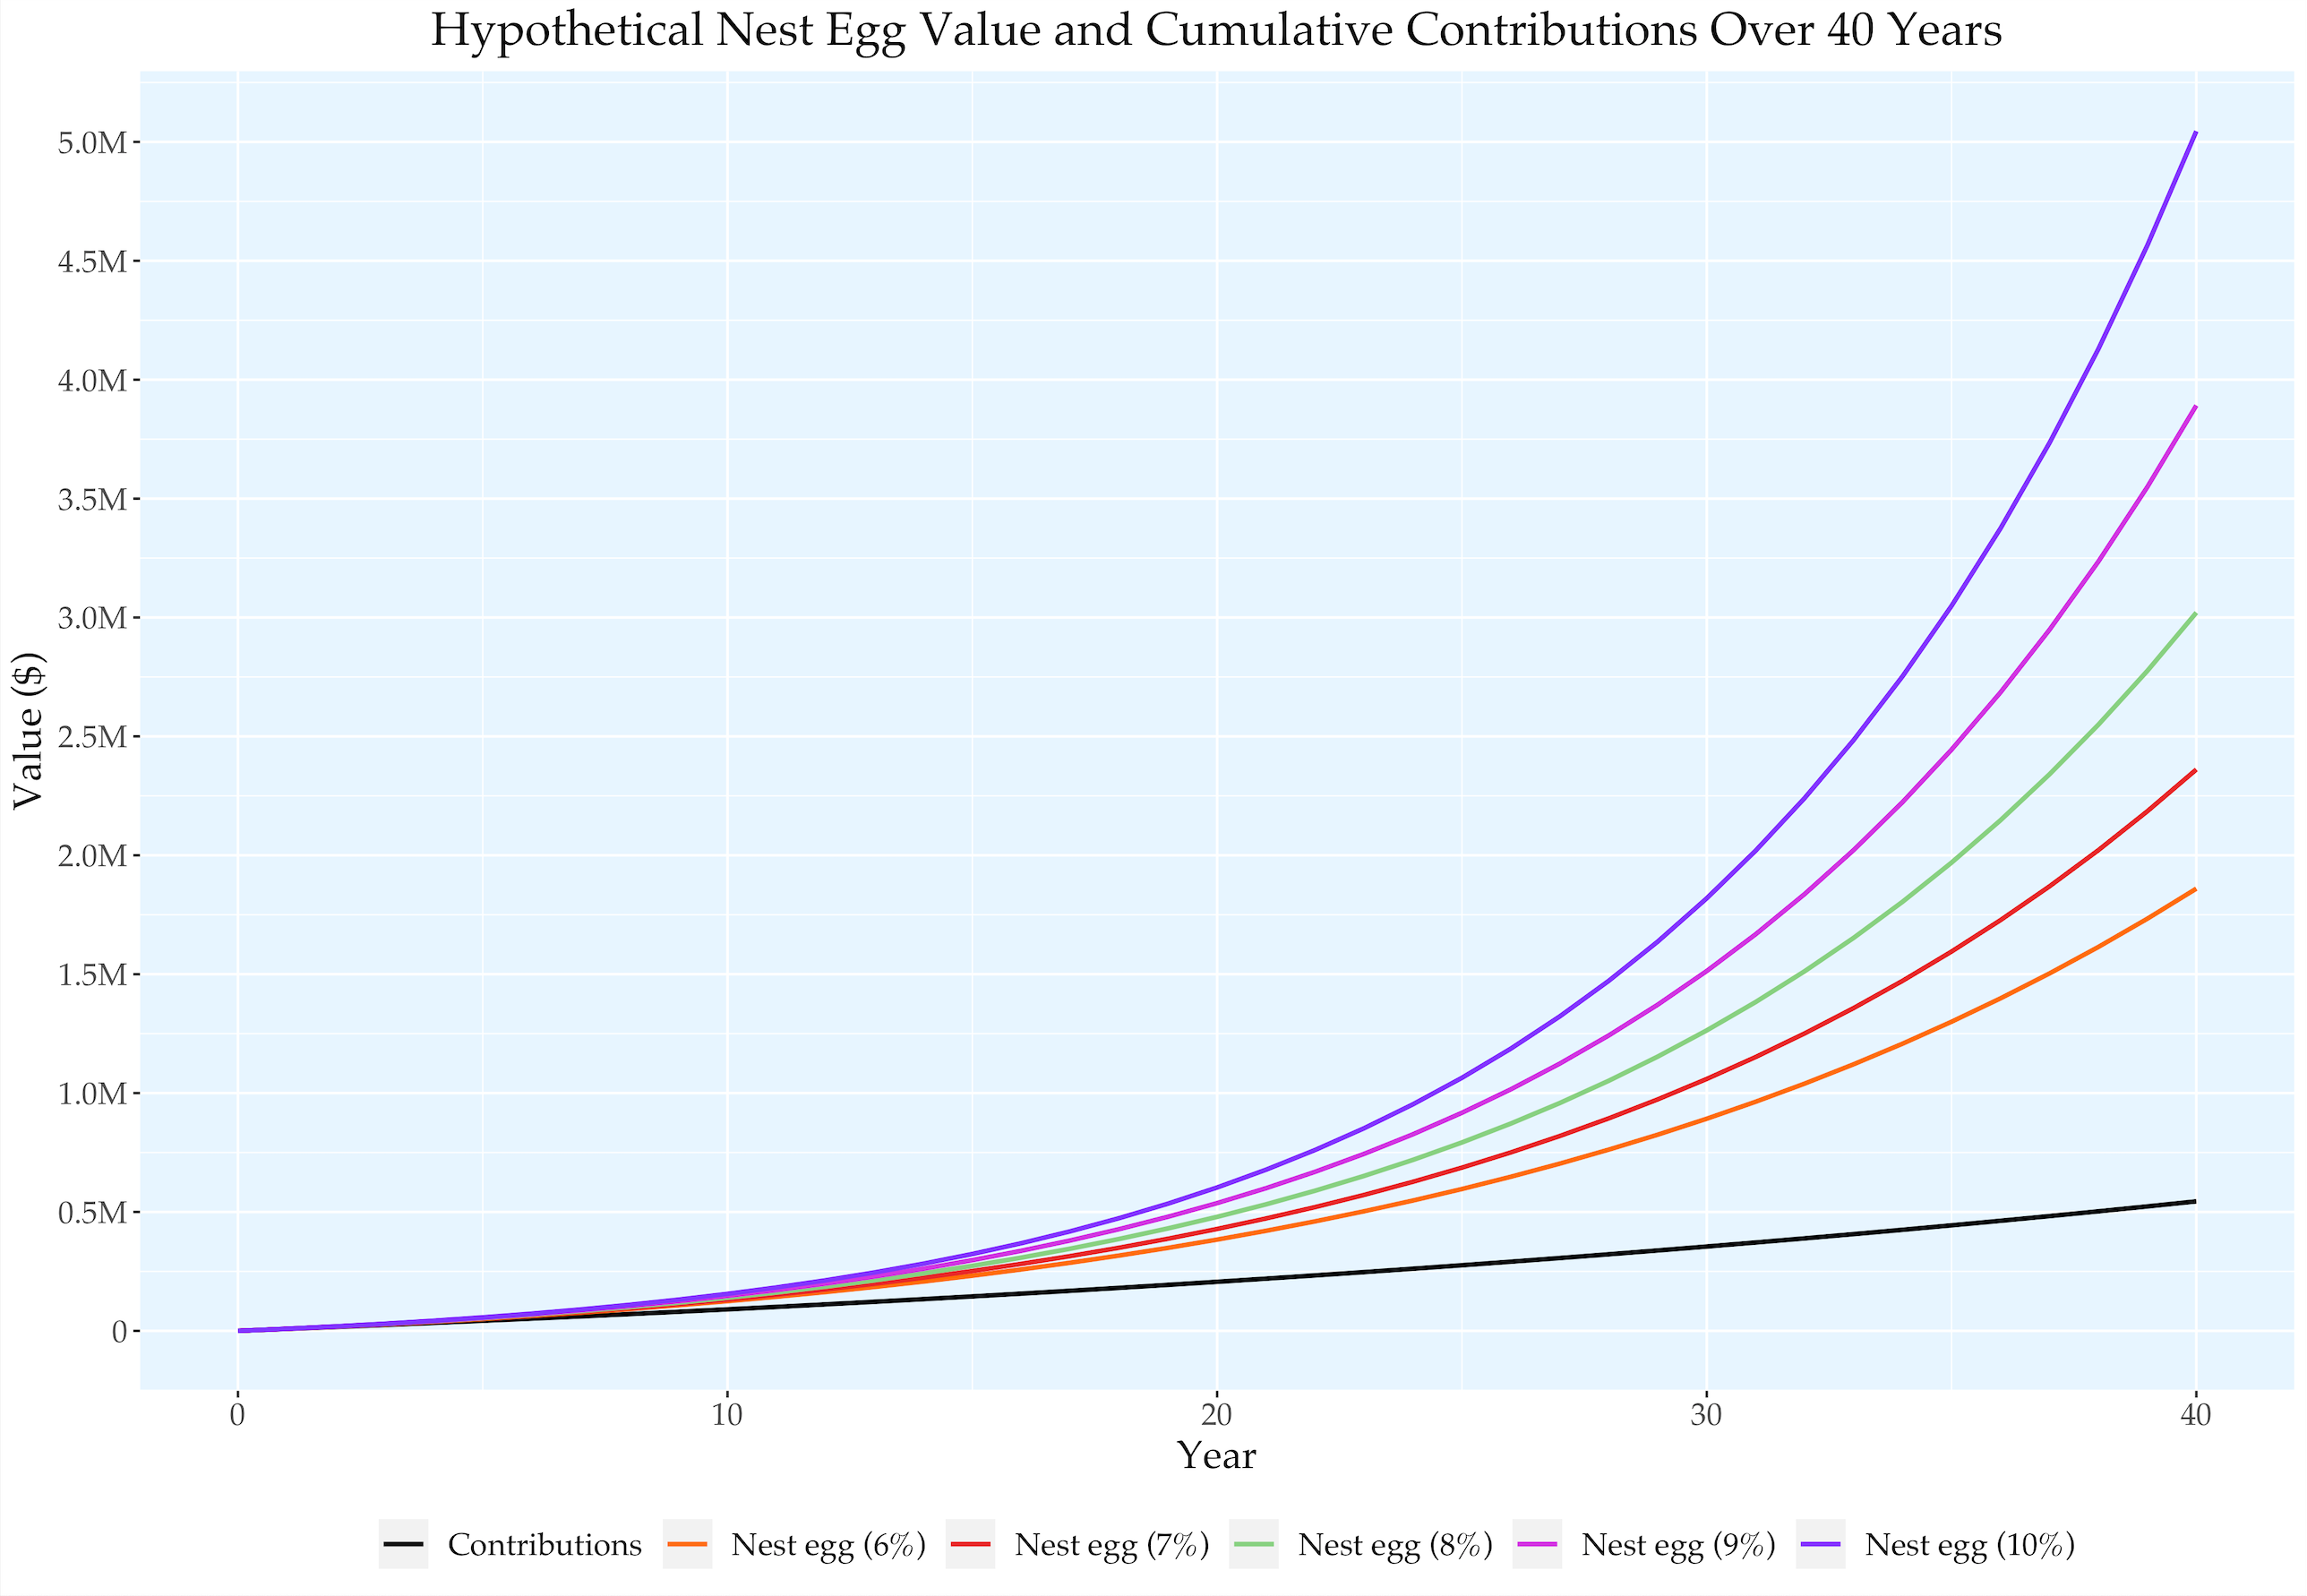
We multiply by 1.025 each year, and the final contribution in the 40th year is $21,165. Our total contributions over 40 years are $544,588. If our nominal returns are 8%, that gives us a nest egg of $3.02M. Withdrawing 4% gives us about $121K in the first year of retirement, which is equivalent to $45K in today’s dollars.
Our contributions were only 18% of the final nest egg and investing took care of the rest!
The figure below shows how these contributions would grow into a retirement nest egg with nominal rates of return between 6% and 10%. Will stock returns in the real world ever be this smooth? OF COURSE NOT. But that’s fine: we’re relying on an average 8% return, not a constant 8% return.
A variation on this approach is to increase contributions each year by last year’s inflation, rather than an expected average like 2.5%. That’s a good idea, but of course when planning you’ll find yourself doing the same calculations because you cannot know what each year’s inflation will be.
Okay, how do you calculate that on your own? I set up three ways you can apply this formula with your own numbers:
Use a spreadsheet in Microsoft Excel, Google Sheets, or LibreOffice Calc. This option has the most detailed output, and it’s easy to use without spreadsheet experience. You can only view my version, so to edit your own version, click File > Create a copy for Excel or File > Make a copy for Sheets. You may need to log into a Microsoft/Google account. If you prefer free and open-source software, you can download the LibreOffice spreadsheet.
Use the equation in WolframAlpha.
We won’t cover the details here, but anyone interested in how I derived the equation (and what assumptions it relies on) can check out the companion post.

And that’s not all!
The first approach could be called time-invariant or flat: you contribute the same inflation-adjusted amount every year. What if you wanted to shift the growth of your contributions above or below the inflation rate? By increasing the growth rate, you could make smaller contributions early in life, and contribute more as your income rises. And would you look at that, there’s one more variable in the calculator we haven’t included:
Growth rate of contributions beyond inflation.
Let’s take the same middle-class youth scenario where our goal is to draw $45K from a portfolio in 40 years. What if we can’t swing an $8,080 contribution in the first year? We could plan to increase contributions by inflation each year, plus an extra growth factor of 2%.
How much does that help? Now we need to invest $6,109 in the first year, then increase by inflation and the growth factor every year. Since we chose 2.5% for inflation and 2% for the growth factor, the second year’s contribution is:
Each year’s contribution grows by 1.025×1.02 = 1.0455, a total of 4.55%. So the final contribution in the 40th year is $34,642.
The initial contribution was 24% smaller, but we have to make up for that later. The final year’s contribution is 64% larger. And our total contributions over 40 years are $661,735. That’s an increase of about $117,000 or 21.5% compared to the flat approach. Investing still does most of the work for us: we contribute about 22% of the final nest egg (instead of 18%).
We had to save more to build the same wealth in this example, but it’s a more realistic model for many people. On the other hand, if you can frontload your savings early in life, that makes it so much easier to meet your long-term investing goals.
To illustrate a frontloading approach, we could invert the growth factor and make it a shrink factor. Reducing the rate of change below the inflation rate is a form of shrinking, even if the overall rate is still positive. Let’s pick a special case, where we contribute the same dollar amount every year for 40 years.
We need a growth factor that cancels the inflation rate. Since inflation is 1.025 — expressed as a multiplier — our growth factor needs to be the reciprocal: 1/1.025.3
We contribute $10,797 every year, for a total of $431,866. That means we only had to contribute 14% of the final nest egg — a lot less than the other two approaches.
If you’re considering a mini-retirement at some point, you can use the calculator to see what contributions it might take to reach that goal. Let’s say you want to take a break from paid work for a couple years when you reach $300K of investments. You can change the withdrawal rate to 100% and the desired income to $300K, and the right numbers will pop out. Of course that’s not how the calculator was designed, but it’s how you can indicate your target nest egg. It will show a larger number for the nest egg because that’s expressed in future dollars.
If you don’t expect consistent growth of your retirement contributions, you can use the current balance variable to hack the calculation. Let’s say we’re a 30-year-old physician in medical residency, and we want to retire at age 60. We plan to make small retirement contributions for the next three years until we become an attending, after which we can shift to a much higher level. There’s no way to model a single jump in contributions with the growth factor variable.
Let’s say we make $5,000 contributions to a Roth IRA for each of the next three years. We can make a rough assumption that by the end of three years, we’ll have a $17,500 portfolio.4
That means we’ll have $17,500 at age 33. We enter that as the current balance and 27 years as the time horizon, to immediately start planning how we’ll invest for retirement as an attending.
—
Okay, that was a lot of math. But what can we learn from all that? And what’s up with Social Security? What other factors should we consider when making a plan for retirement? How do popular rules of thumb hold up? This post already had a lot of information, so we’ll take a break here. See you next week!
Update: the next post is now available.

Further resources
Every Money IRL post is organized in The Omni-Post, and all vocab terms are here.
This Wall Street Journal article is about how “[w]orkers are chronically overly optimistic about how long they can remain on the job”.
Ramit Sethi’s content is focused on a balance of financial responsibility and truly enjoying your money, which everyone has to consider when deciding how much to spend now and how much to save for the future. I link to a bunch of his videos in the Vocab & Further resources post.
Check out the gentle intro to investing for more info on investing for retirement and other goals. For more on exponential growth and protecting your gains from tax, check out our post on “Why tax-advantaged accounts are great”.
—
We love comments here. Tell us what you like or dislike, agree or disagree with. Recall a long story barely related to this post. Ask a question!
Please send photos of your pets if you’d like to see them in future posts. Or suggest a new topic, or say hi! You can email or tap the message button. Stay safe out there.
Email: bright.tulip711@simplelogin.com
—
See the 2023 summary edition (p. 15, fig. 11) of the Credit Suisse Global Investment Returns Yearbook for recent stock data showing that the average real return (i.e., after inflation) has been about 5%. The exact number varies depending on whether they report local currency returns (as in the 2023 summary edition) or USD returns (as in the 2021 summary edition), which are more relevant and have been slightly above 5%. Excluding a few periods of hyperinflation, the average inflation they find is about 2.6% (p. 16, fig. 5). These translate to a roughly 8% nominal return.
The real return is the number that affects the calculation of your initial contribution. You could assume a nominal return of 8.53% and an inflation rate of 3%, which would give you the same 5.37% real return and the same initial contribution.
You can calculate this yourself with the spreadsheet. On the right-hand side, enter 3 for time horizon, 0 for inflation and growth rate, and $5,000 for first year contribution. Keep the nominal return at 8%. This calculates how three $5,000 contributions over three years will grow at an 8% annual rate. “Total nest egg at retirement (in future dollars)” is now $17,531.
GREAT stuff, thank you! I passed this one along to a couple people. :)
Thank you this is very helpful because I just got my first full time job